← All visual series

Bent Measures

Follow the burden past the number on the label.

These field-note explainers combine diagrams, visible claims, and source receipts. Open a visual to inspect the original; open its transcript to read the material labels, scope, and evidence trail in HTML.

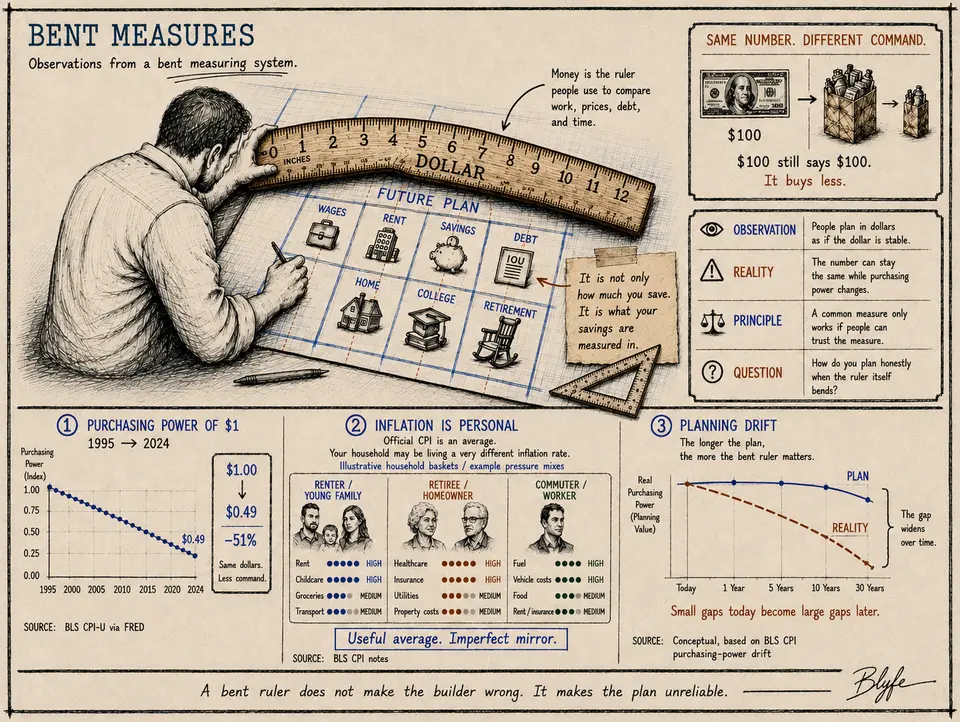
Bent Measures visual showing a person measuring a future plan with a dollar ruler that bends as purchasing power changes over time.

Bent Measures BM0002

The Bent Measuring Stick

Money is the ruler people use to measure wages, debt, savings, prices, and future plans.

Bent Measures

The Bent Measuring Stick

A bent ruler does not make the builder wrong. It makes the plan unreliable.

Bent Measures visual showing a person measuring a future plan with a dollar ruler that bends as purchasing power changes over time.
Read the visual transcript and evidence receipt

Figure transcript

Main point

Money is the common ruler used to compare work, prices, debt, savings, and plans separated by years. The number printed on a dollar does not change, but the amount it can buy does. The visual asks a practical question: how should a household plan when the unit used in the plan changes over time?

The image does not claim that official inflation measures are false. It makes a narrower point. A broad average is useful for measuring the economy, but it is an imperfect mirror of any one household’s costs.

Reading order
  1. The large central drawing shows a person laying a curved dollar ruler across a future plan.
  2. The upper-right panel states the observation, the reality, the principle, and the question.
  3. The lower-left chart translates the change in the CPI-U into the purchasing power of one 1995 dollar in 2024.
  4. The lower-middle panel distinguishes the official average from three illustrative household cost mixes.
  5. The lower-right panel shows planning drift as a concept: a small gap near the present can become a large gap over a long plan.
Material labels and values

The central blueprint is titled “Future Plan.” Its labeled cells are wages, rent, savings, debt, home, college, and retirement. A note beside the debt cell reads: “It is not only how much you save. It is what your savings are measured in.” The wooden ruler is marked from zero to twelve and labeled “Dollar.” A callout says: “Money is the ruler people use to compare work, prices, debt, and time.”

The first upper-right panel is titled “Same number. Different command.” It shows a $100 bill followed by a full grocery bag and then a smaller bag. The text reads: “$100 still says $100. It buys less.”

The next panel contains four field notes:

  • Observation: People plan in dollars as if the dollar is stable.
  • Reality: The number can stay the same while purchasing power changes.
  • Principle: A common measure only works if people can trust the measure.
  • Question: How do you plan honestly when the ruler itself bends?

Panel 1 is titled “Purchasing Power of $1, 1995 → 2024.” The plotted index starts at 1.00 in 1995 and ends at $0.49 in 2024. A boxed calculation states “$1.00 ↓ $0.49, −51%” followed by “Same dollars. Less command.” This is a rounded purchasing-power conversion based on annual CPI-U values: the 2024 dollar retained about 49% of the purchasing power of a 1995 dollar. The source label reads “BLS CPI-U via FRED.”

Panel 2 is titled “Inflation Is Personal.” It says: “Official CPI is an average. Your household may be living a very different inflation rate.” The three baskets are explicitly labeled “Illustrative household baskets / example pressure mixes.” They are not survey estimates:

  • Renter / young family: rent and childcare are marked high; groceries and transport are marked medium.
  • Retiree / homeowner: healthcare and insurance are marked high; utilities and property costs are marked medium.
  • Commuter / worker: fuel and vehicle costs are marked high; food and rent/insurance are marked medium.

The panel concludes: “Useful average. Imperfect mirror.” Its source label reads “BLS CPI notes.”

Panel 3 is titled “Planning Drift.” A solid blue plan line and a falling dashed reality line are drawn across today, one year, five years, ten years, and thirty years. No numeric forecast is attached to either line. The labels say: “The longer the plan, the more the bent ruler matters,” “The gap widens over time,” and “Small gaps today become large gaps later.” The source label describes the panel as conceptual and based on BLS CPI purchasing-power drift.

The closing line at the bottom of the plate reads: “A bent ruler does not make the builder wrong. It makes the plan unreliable.”

Scope and caveats

The CPI-U is a national average for urban consumers, not a personal cost-of-living index. The $0.49 endpoint uses annual averages and is rounded to the nearest cent. A household’s actual experience depends on what it buys, where it lives, its housing tenure, and how its purchases change. The three household baskets illustrate those differences; they do not quantify them. The planning-drift panel is a conceptual warning, not a thirty-year inflation forecast or investment recommendation.

This figure does not establish why purchasing power changed, which institution or policy caused it, or what asset a reader should hold. Those questions require separate evidence.

Editorial layer
  • Sourced: the historical CPI-U series and the purchasing-power calculation shown in Panel 1.
  • Inferred: different household spending mixes can produce different experienced inflation, consistent with BLS research on inflation across household groups.
  • Argued: a changing unit of account makes long-horizon household planning less reliable when the change is not explicitly included in the plan.
  • Illustrative: the pressure dots in Panel 2 and both lines in Panel 3.
Update and correction status

Status: current. The visible historical endpoint, the labels, and the source notes were compared with the cited records on August 27, 2026. The next freshness review is due August 27, 2027. If BLS revises the annual historical series in a way that changes the rounded endpoint, the figure and this transcript must be corrected together.

Evidence receipt

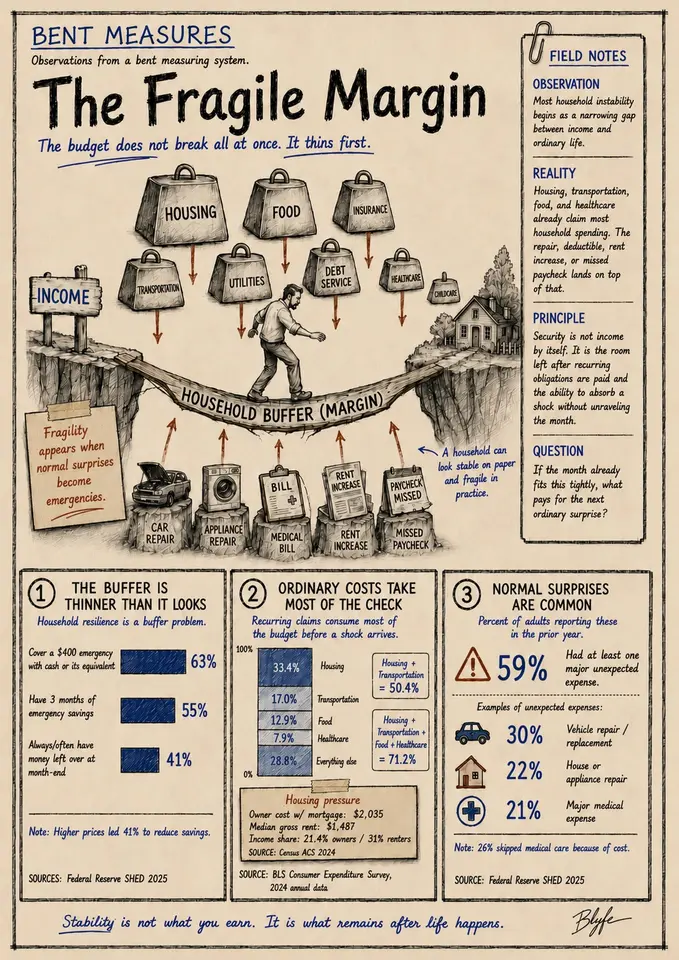
Bent Measures visual showing a household buffer bridge thinning under recurring costs while ordinary surprises rise from below.

Bent Measures BM0005

The Fragile Margin

Household instability often begins before anything visibly breaks.

Bent Measures

The Fragile Margin

Stability is not what you earn. It is what remains after life happens.

Bent Measures visual showing a household buffer bridge thinning under recurring costs while ordinary surprises rise from below.
Read the visual transcript and evidence receipt

Figure transcript

Main point

The plate shows a household budget as a bridge. Regular bills press down from above. Repairs, medical costs, and other ordinary surprises rise from below. The bridge can become fragile while it still appears to be standing.

The evidence is about financial margin, not character. A household may be paying every bill and still have too little room to absorb the next one.

Reading order
  1. The center drawing shows a family crossing a narrowing bridge labeled “Household buffer.”
  2. Panel 1 measures the room households report having before a shock.
  3. Panel 2 shows how much of average spending is already committed to major categories.
  4. Panel 3 shows how common unexpected expenses and deferred medical care are.
  5. The closing note returns to the bridge: the visible break is late evidence.
Material labels and values

The loads above the bridge are labeled housing, transportation, food, healthcare, insurance, utilities, debt, childcare, and taxes. The shocks below it include a car repair, appliance failure, medical bill, home repair, lost work, and family need.

Panel 1 is titled “How much room is left?” It reports four Federal Reserve SHED findings for 2025:

  • 63% of adults said they would cover a $400 emergency expense with cash or its equivalent.
  • 55% said they had savings set aside to cover three months of expenses.
  • 41% said they always or often had money left over at the end of the month.
  • 41% said higher prices had caused them to reduce savings.

Panel 2 is titled “The fixed-cost wall.” It uses the 2024 Consumer Expenditure Survey to show average spending shares: housing 33.4%, transportation 17.0%, food 12.9%, healthcare 7.9%, and everything else 28.8%. Housing and transportation together account for 50.4%; adding food and healthcare brings the total to 71.2%.

The housing note adds two 2024 American Community Survey medians: gross rent of $1,487 a month, and housing costs equal to 21.4% of income for owners with a mortgage and 31.0% for renters.

Panel 3 is titled “Ordinary surprise, thin buffer.” It reports that 59% of adults had at least one unexpected major expense in 2025. The most common categories shown are vehicle repair at 30%, house or appliance repair at 22%, and medical expense at 21%. A separate line notes that 26% skipped some medical care because of cost.

Scope and caveats

The plate combines national surveys with different populations and measurement frames. Consumer Expenditure Survey shares are averages, while ACS housing figures are medians and SHED results describe surveyed adults. They should not be read as one model household.

Having three months of savings is a respondent-reported threshold, not proof that the savings would cover every shock. The unexpected-expense categories can overlap. The bridge and its loads are editorial illustrations; they are not a forecast of failure for any particular family.

Editorial layer
  • Sourced: the SHED percentages, Consumer Expenditure Survey shares, and ACS housing medians printed on the plate.
  • Inferred: when large recurring categories occupy much of a budget, a household has less room to absorb a new bill.
  • Argued: household fragility often appears first as a narrowing margin rather than a missed payment.
  • Illustrative: the bridge, weights, cracks, and rising shocks.
Update and correction status

Status: current. The visible figures and source labels were compared with the cited public records on August 30, 2026. The next freshness review is due August 30, 2027. A material revision to any source or a change to a printed value requires a coordinated plate-and-transcript correction.

Evidence receipt

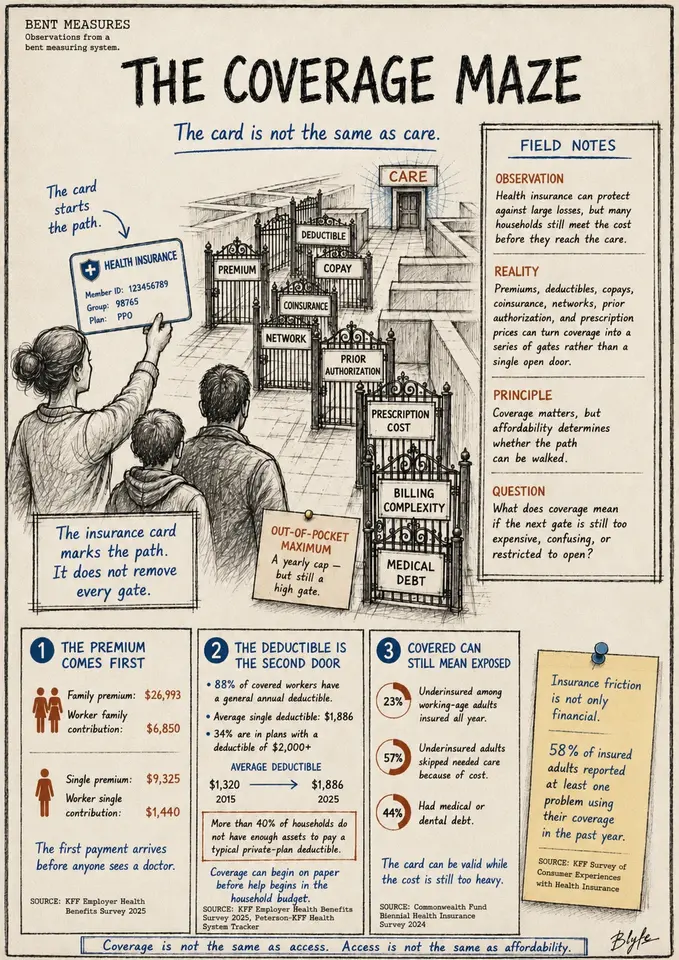
Bent Measures visual showing a family facing a maze of healthcare gates labeled premium, deductible, copay, network, prior authorization, prescription cost, billing complexity, and medical debt.

Bent Measures BM0009

The Coverage Maze

A health insurance card can mark the path to care, but it does not remove every gate.

Bent Measures

The Coverage Maze

Coverage is not the same as access. Access is not the same as affordability.

Bent Measures visual showing a family facing a maze of healthcare gates labeled premium, deductible, copay, network, prior authorization, prescription cost, billing complexity, and medical debt.
Read the visual transcript and evidence receipt

Figure transcript

Main point

The plate begins with an insurance card and then makes the reader walk the rest of the route. Premiums buy coverage. A deductible, network, authorization rule, drug price, or disputed bill can still stand between the card and usable care.

This is not an argument that coverage has no value. It separates three things that are often collapsed: being insured, reaching care, and being able to afford the care reached.

Reading order
  1. A family enters the maze holding an insurance card.
  2. The premium panel shows what employer-sponsored coverage costs before care is used.
  3. The deductible panel shows what many workers face when they do use care.
  4. The underinsurance panel records skipped care and debt among adults with coverage.
  5. The center note names the administrative gates that create friction even when a bill is payable.
Material labels and values

The maze walls are labeled premium, deductible, copay, coinsurance, network, prior authorization, prescription cost, billing complexity, and medical debt.

The 2025 employer-coverage panel reports an average annual family premium of $26,993, with the worker contributing $6,850. The average single premium is $9,325, with the worker contributing $1,440.

The deductible panel reports that 88% of covered workers were in a plan with a general annual deductible for single coverage. Among workers in plans with a deductible, the average was $1,886. Thirty-four percent of all covered workers were in a plan with a general annual deductible of $2,000 or more. The average for workers in plans with a deductible rose from $1,320 in 2015 to $1,886 in 2025, an increase of more than 40%.

The 2024 underinsurance panel reports that 23% of working-age adults who were insured all year were underinsured. Among underinsured adults, 57% skipped needed care because of cost and 44% had medical or dental debt.

A separate KFF note reports that 58% of insured adults experienced at least one problem using their health insurance in the prior year, including denied claims, network problems, and preauthorization problems.

Scope and caveats

The premium and deductible figures describe employer-sponsored insurance; they do not represent Medicare, Medicaid, Marketplace plans, or the uninsured. Worker contributions are only one part of the premium. Deductibles do not capture copayments, coinsurance, out-of-pocket limits, employer account contributions, or services covered before the deductible.

The underinsurance and coverage-problem results come from different surveys with different definitions and field dates. “Experienced a problem” does not mean every problem prevented care. The maze is an editorial representation of friction, not a count of gates faced by every patient.

Editorial layer
  • Sourced: the KFF premium, deductible, and coverage-problem figures and the Commonwealth Fund underinsurance findings printed on the plate.
  • Inferred: insurance rules can impose money and time costs after a person has obtained coverage.
  • Argued: coverage, access, and affordability should be measured separately.
  • Illustrative: the maze, gates, signs, and family route.
Update and correction status

Status: current. The visible figures and definitions were compared with the cited public records on August 30, 2026. The next freshness review is due August 30, 2027. Premiums, deductibles, and survey findings are vintage-specific and should retain their printed years when newer data arrive.

Evidence receipt

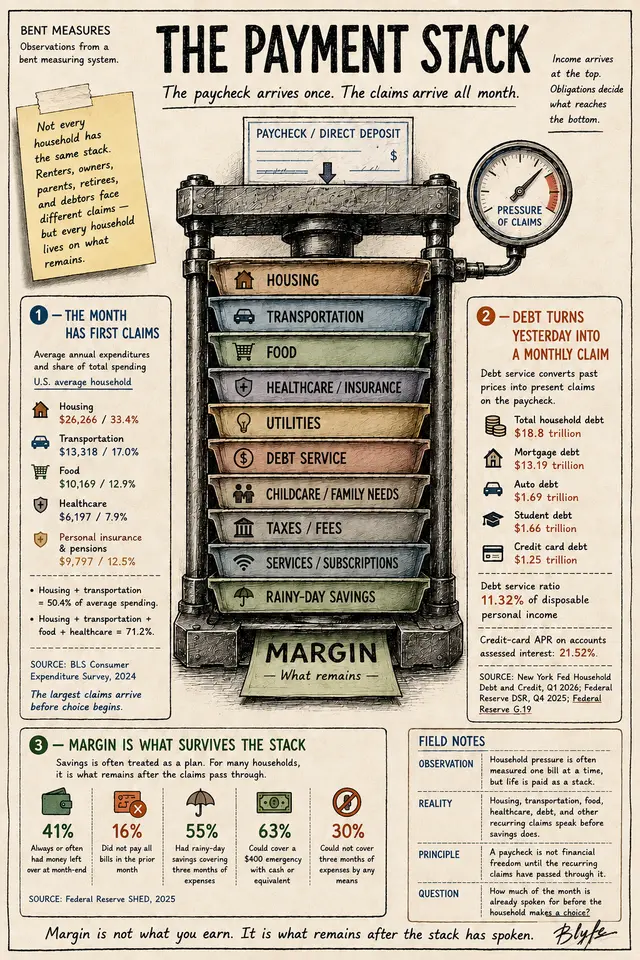
Bent Measures visual showing a paycheck pressed through a stack of recurring claims including housing, transportation, food, healthcare, utilities, debt service, taxes, subscriptions, and savings.

Bent Measures BM0010

The Payment Stack

The paycheck arrives once. The claims arrive all month.

Bent Measures

The Payment Stack

Margin is what remains after the stack has spoken.

Bent Measures visual showing a paycheck pressed through a stack of recurring claims including housing, transportation, food, healthcare, utilities, debt service, taxes, subscriptions, and savings.
Read the visual transcript and evidence receipt

Figure transcript

Main point

The drawing feeds one paycheck into a press made of recurring claims. No single payment explains the result. The stack does.

The plate uses national aggregates to show the scale of several claims on household income. It does not construct a typical family or prescribe how a household should budget.

Reading order
  1. The paycheck enters at the top of the payment press.
  2. The household-spending panel shows where average 2024 expenditures went.
  3. The debt panel shows outstanding balances and two borrowing-cost measures.
  4. The household-margin panel reports whether adults had room after their bills.
  5. The remainder exits at the bottom as margin, if any.
Material labels and values

The plates in the press are labeled housing, transportation, food, healthcare, utilities, debt service, taxes, services, subscriptions, and savings needs.

The 2024 Consumer Expenditure Survey panel reports average annual spending and shares for five categories: housing $26,266 and 33.4%; transportation $13,318 and 17.0%; food $10,169 and 12.9%; healthcare $6,197 and 7.9%; and personal insurance and pensions $9,797 and 12.5%. Housing and transportation together account for 50.4%. Adding food and healthcare brings the total to 71.2%.

The household-debt panel uses the New York Fed’s first-quarter 2026 report. Total household debt is $18.8 trillion, including $13.19 trillion in mortgages, $1.69 trillion in auto loans, $1.66 trillion in student loans, and $1.25 trillion in credit-card balances.

Two rate measures sit beside the balances. The Federal Reserve household debt-service ratio is 11.32% of disposable personal income for 2025 Q4. The average credit-card annual percentage rate on accounts assessed interest is 21.52% for 2026 Q1.

The 2025 household-margin panel reports:

  • 41% of adults always or often had money left over at the end of the month.
  • 16% did not pay all their bills in full in the prior month.
  • 55% had savings set aside to cover three months of expenses.
  • 63% would cover a $400 emergency expense with cash or its equivalent.
  • 30% could not cover three months of expenses by any means.
Scope and caveats

The spending figures are averages for consumer units, the debt figures are national balances, the debt-service ratio is an economy-wide ratio, and the household-margin figures are survey responses. They do not belong to one synthetic household.

Debt balances are stocks, while annual spending and monthly bills are flows. The credit-card APR applies to accounts assessed interest, not all card accounts. “Savings needs” is an editorial label: saving is not a bill from an outside institution, though households may treat it as a claim on income.

Editorial layer
  • Sourced: the spending, debt, rate, savings, emergency-expense, and bill-payment values printed on the plate.
  • Inferred: several recurring claims can narrow household margin even when income has not fallen.
  • Argued: a paycheck should be evaluated by what remains after the stack, not by its gross amount alone.
  • Illustrative: the press, compression plates, paycheck, and remainder.
Update and correction status

The rate citations and observation periods were corrected on September 7, 2026. The plate retains historical observations: 2025 Q4 for debt service and 2026 Q1 for card APR. The remaining figures retain their August 30 review. The next rate-source review is due September 30, 2026. Quarterly balances and interest rates move more often than the annual plate; the printed vintage remains part of the claim.

Evidence receipt

Special Bent Measures visual comparing technology panics across looms, railroads, radio, comic books, automation, computers, internet, social media, and AI.

Bent Measures BMSP001

The Panic Press

Every age thinks the new machine has finally broken history.

Bent Measures

The Panic Press

Fear becomes useful only when it is converted into judgment, standards, and stronger institutions.

Special Bent Measures visual comparing technology panics across looms, railroads, radio, comic books, automation, computers, internet, social media, and AI.
Read the visual transcript and evidence receipt

Figure transcript

Main point

The plate lays two centuries of technology anxiety on a printing press. The wording changes. The recurring fears do not: work disappears, children are corrupted, truth collapses, institutions are unprepared, and power concentrates.

Repetition does not make every fear foolish. It makes sorting more important. A claim can overstate the aggregate threat while identifying a real local harm.

Reading order
  1. The left column is a dated archive of public alarms about new machines and media.
  2. The press in the center compresses those episodes into a recurring “fear grammar.”
  3. The right column applies that grammar to current AI debate.
  4. Four drawers at the bottom sort claims into overreaction, real harm, wrong target, and useful reform.
  5. The final note asks what evidence and institutional response each claim deserves.
Material labels and values

The historical archive names textile looms and the Luddites in the 1810s; railroads and the press in the 1830s; mechanical music criticism in 1906; radio criticism in the 1920s; the 1954 U.S. Senate comic-book hearings; automation coverage in the 1960s; office-computer anxiety in the 1980s and 1990s; internet coverage in 1995; social-media debate in the 2010s; and AI coverage in the 2020s.

The repeated fear grammar is labeled:

  • end of work;
  • children corrupted;
  • truth collapses;
  • society unprepared; and
  • power consolidates.

The “panic is not always wrong” panel separates three judgments. Aggregate job-apocalypse claims have often been overstated. Transition costs can still be concentrated and severe. Institutional weakness is sometimes blamed on the new tool even when the tool merely exposes it.

The AI rhyme names labor, truth, children, creativity, monopoly, and security. The four sorting drawers are overreaction, real harm, wrong target, and useful reform.

No numeric trend is claimed. The dates identify archive episodes, not the start or end of a social debate.

Scope and caveats

This is a selected archive, not a census of technology criticism. The entries differ in medium, audience, political context, and consequence. Putting them on one plate does not claim that looms, radio, comic books, social media, and AI are equivalent technologies.

Historical repetition cannot by itself show that a present warning is false. Nor does a valid warning establish the size, distribution, or duration of harm. The four drawers are an editorial method for asking better questions, not settled classifications of every example.

Editorial layer
  • Sourced: the existence, date range, and general subject of the historical episodes named on the plate.
  • Inferred: several episodes use recurring categories of fear despite large differences in technology and context.
  • Argued: public judgment improves when claims are separated into scale, distribution, target, and remedy.
  • Illustrative: the press, repeating headlines, fear grammar, and sorting drawers.
Update and correction status

The Senate citation was corrected on September 7, 2026 after it redirected to a missing-page screen. The 1954 hearing is supported by the linked National Archives documents. The remaining archive labels retain their August 30 review; item-level citations for the other episodes still require follow-up. The next archive-source review is due September 30, 2026. New AI evidence belongs in a dated extension; it should not rewrite the historical examples to make the current analogy cleaner.

Evidence receipt