
 01 · Money Cost Migration The price is not the whole cost The first price can leave out required charges, smaller quantities, work you must do yourself, upkeep, risk, or the cost of leaving. Follow the deal until the obligation is actually finished. For example: A $199 hotel room becomes $238 before tax when a required fee appears later.
The moment the story breaks
Prices, services, measurements, and institutional processes can stop matching the reality people encounter.
What the…!?
Something here does not add up.
WTF is the question. Evidence is how we keep the answer honest.
bent.WTF makes hidden burdens legible—where price, time, access, and official numbers stop telling the whole story.
Price autopsy
Where did the rest of the price go?
Start with the number presented first. Then trace the fees, changed units, financing, upkeep, time, risk, and work that sit outside it.
A short introduction
Five ways into bent.WTF.
This five-part introduction gives you the basic idea before the site opens into deeper field records, visuals, and long-form analysis. Each page begins with something ordinary: a price, a wait, a number, an offer, or a process. Start with the one you have already felt.
01 · Money Cost Migration The price is not the whole cost The first price can leave out required charges, smaller quantities, work you must do yourself, upkeep, risk, or the cost of leaving. Follow the deal until the obligation is actually finished. For example: A $199 hotel room becomes $238 before tax when a required fee appears later.  02 · Time Time Tax Waiting is a cost A five-minute form can still consume an afternoon. Count the search, hold, travel, repeat work, and follow-up, while keeping hands-on effort and background waiting separate. For example: The call lasts seven minutes after someone answers; reaching that point takes fifty.
 03 · Numbers Measurement Failure The measure is not the reality A statistic answers a defined question. Trouble starts when a headline stretches it across more people, more time, or a larger idea than the method covers. Check who and what was counted. For example: An average can rise even while most households see little change.
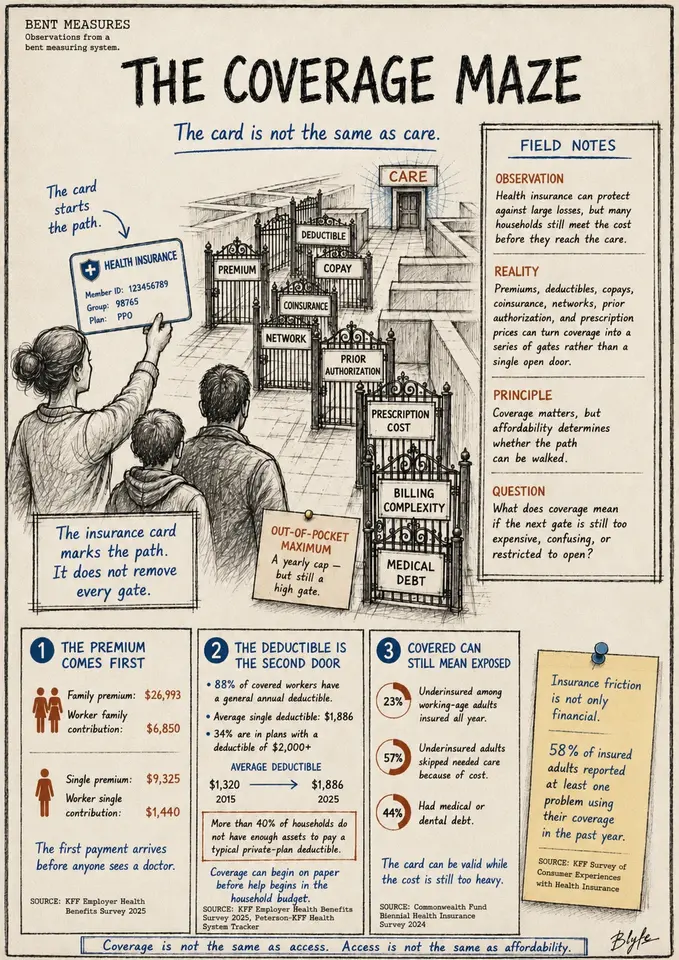 04 · Access Access Distortion An offer is not access A service can be open and still be hard to use. Papers, devices, office hours, travel, language, money, and recovery rules decide whether a person can get through. For example: A clinic takes the insurance plan, but booking still depends on a referral and prior approval. 05 · Institutions Institutional Drift One promise, many processes Rules, vendors, handoffs, and local targets can pile up until every part has an owner and the whole experience does not. Trace the promise, the route, and what later repairs changed. For example: Every department finishes its step while the person between them keeps waiting.
After this orientation, keep going through the Library, visuals, and longer analysis. Each card opens a plain-language explanation, an everyday example, the strongest countercase, the open questions, and links into the larger record.
Field Reports
Start with the price, the clock, or the official number.
A price moves without changing the tag. A form gets shorter while the work around it grows. An official number answers its question and gets promoted to answer three more. These reports follow the discrepancy back to the record.
Money · cost migration
The Price Tag Mask
The first number can be accurate and still leave most of the obligation for later.
Time · time tax
The Return Has a Second Total
The tax result gets the bold type. The work required to produce it is printed much farther back.
Numbers · measurement failure
The Number Is Right. The Question Is Wrong.
A national price index can do its assigned job and still be useless for the question someone is actually asking.
Current Library file
The Price Tag Mask
The visible price can be true and still incomplete. This Library topic tracks the gap between the first number people see and the full cost they carry.
- Visible measure
- Advertised price
- Real burden
- Fees, risk, upkeep, financing, time
- Long-form state
- Field report and Library record available
Library
A living reference system.
26 public topic records hold 141 source-backed exhibits. Each exhibit keeps its claim, scope, caveat, and source trail close.
Lens 4 topics · 18 exhibits
Active Cost Migration
Cost moves out of the visible price and into fees, upkeep, financing, risk, smaller units, or household work.
- Cost Migration 10
- Hidden Cost 10
- Household Margin 10
- The Price Tag Mask 10
Lens 3 topics · 10 exhibits
Active Time Tax
A system keeps its stated price while shifting calls, forms, waiting, retries, and follow-up onto the person using it.
- Administrative Burden 10
- Sludge 10
- Time Tax 10
Lens 3 topics · 15 exhibits
Active Measurement Failure
A clean figure hides a changed denominator, missing burden, weak comparison, or distance from the thing people are trying to understand.
Lens 1 topic · 10 exhibits
Active Access Distortion
Something remains available on paper while price, timing, paperwork, eligibility, or risk makes access harder in practice.
Lens 1 topic · 10 exhibits
Active Institutional Drift
A public promise and the process meant to deliver it slowly separate, leaving people to find the gap for themselves.
Evidence sample
Compact exhibits, not detached claims.
Each exhibit keeps the fact, source, caveat, and implication close to the topic it supports.
Exhibit HIGH confidence
Hidden Mandatory Fees Break Price Comparison
Mandatory fees can make the advertised price lower than the real price the buyer must pay.
- Source
- Federal rule guidance and enforcement announcement
- Implication
- If the mandatory fee appears after the buyer has already compared options, the visible price is not a reliable measuring stick. The buyer is comparing teaser prices while the real cost is delayed.
Trace this finding
- 01 · Finding
Mandatory fees can make the advertised price lower than the real price the buyer must pay.
- 02 · Boundary
United States federal consumer-protection rule — Price displays for live-event tickets and short-term lodging covered by 16 C.F.R. Part 464
- 03 · Source
Tier A · Federal rule guidance and enforcement announcement
- 04 · Review
Reviewed August 27, 2026; due again February 27, 2027
Exhibit HIGH confidence
A 2000 Dollar Buys About Half as Much by CPI-U
Using BLS CPI-U index values, the price level was 94.6% higher in May 2026 than the 2000 annual average.
- Source
- Federal statistical table and archived news release
- Implication
- Nominal dollars keep the same name while the amount they can buy changes. That can make a wage, savings balance, or long-term target look stable even when its broad purchasing power has moved.
Trace this finding
- 01 · Finding
Using BLS CPI-U index values, the price level was 94.6% higher in May 2026 than the 2000 annual average.
- 02 · Boundary
United States urban consumers — CPI-U U.S. city average, all items, not seasonally adjusted; 2000 annual average compared with May 2026
- 03 · Source
Tier A · Federal statistical table and archived news release
- 04 · Review
Reviewed August 28, 2026; due again June 30, 2027
Exhibit HIGH confidence
Filing Taxes Has a Measured Time and Cash Burden
The IRS estimates pre-filing and filing time separately from out-of-pocket preparation cost, with substantial differences between nonbusiness and business individual returns.
- Source
- Government form instructions, official burden methodology, and active federal information-collection record
- Implication
- The tax due or refund is only the final account. The filing process also consumes records, planning, preparation time, software or professional help, and calendar space. The IRS already treats those as measurable compliance burden.
Trace this finding
- 01 · Finding
The IRS estimates pre-filing and filing time separately from out-of-pocket preparation cost, with substantial differences between nonbusiness and business individual returns.
- 02 · Boundary
United States federal individual income tax — IRS national average burden estimates for tax year 2025 Form 1040 and 1040-SR returns, including associated forms and schedules and excluding post-filing activity
- 03 · Source
Tier A · Government form instructions, official burden methodology, and active federal information-collection record
- 04 · Review
Reviewed August 30, 2026; due again December 15, 2026
How a claim is handled
A source can establish the fact. The interpretation still has to show its work.
bent.WTF keeps the record, the inference, and the editorial judgment separate enough to inspect.
- 01
Sourced
A figure, rule, finding, or event tied to the record and kept inside its stated scope.
- 02
Inferred
A bounded conclusion drawn from sourced facts. The reasoning has to remain visible.
- 03
Argued
The editorial judgment: what the pattern means, who carries the burden, and what deserves another look.
Visuals
Bent Measures and Bent Lines.
Visuals turn the same evidence posture into diagrams, field notes, and single-panel editorial scenes.
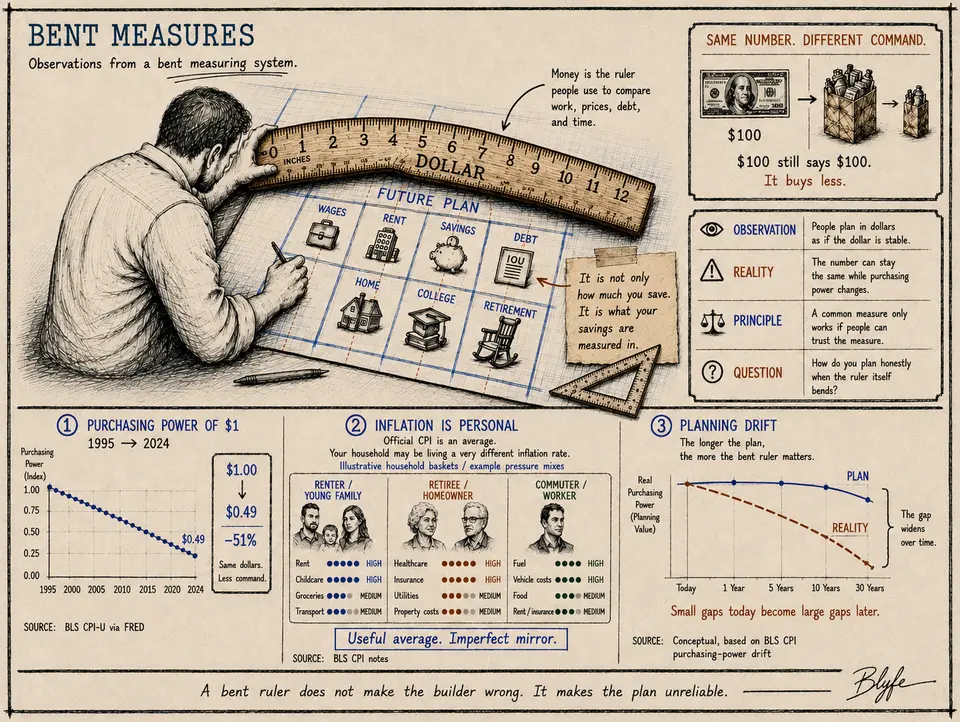
Open Visuals Bent Measures BM0002
The Bent Measuring Stick
Money is the ruler people use to measure wages, debt, savings, prices, and future plans.
Read the visual transcript and evidence receipt
Figure transcript
Main point
Money is the common ruler used to compare work, prices, debt, savings, and plans separated by years. The number printed on a dollar does not change, but the amount it can buy does. The visual asks a practical question: how should a household plan when the unit used in the plan changes over time?
The image does not claim that official inflation measures are false. It makes a narrower point. A broad average is useful for measuring the economy, but it is an imperfect mirror of any one household’s costs.
Reading order
- The large central drawing shows a person laying a curved dollar ruler across a future plan.
- The upper-right panel states the observation, the reality, the principle, and the question.
- The lower-left chart translates the change in the CPI-U into the purchasing power of one 1995 dollar in 2024.
- The lower-middle panel distinguishes the official average from three illustrative household cost mixes.
- The lower-right panel shows planning drift as a concept: a small gap near the present can become a large gap over a long plan.
Material labels and values
The central blueprint is titled “Future Plan.” Its labeled cells are wages, rent, savings, debt, home, college, and retirement. A note beside the debt cell reads: “It is not only how much you save. It is what your savings are measured in.” The wooden ruler is marked from zero to twelve and labeled “Dollar.” A callout says: “Money is the ruler people use to compare work, prices, debt, and time.”
The first upper-right panel is titled “Same number. Different command.” It shows a $100 bill followed by a full grocery bag and then a smaller bag. The text reads: “$100 still says $100. It buys less.”
The next panel contains four field notes:
- Observation: People plan in dollars as if the dollar is stable.
- Reality: The number can stay the same while purchasing power changes.
- Principle: A common measure only works if people can trust the measure.
- Question: How do you plan honestly when the ruler itself bends?
Panel 1 is titled “Purchasing Power of $1, 1995 → 2024.” The plotted index starts at 1.00 in 1995 and ends at $0.49 in 2024. A boxed calculation states “$1.00 ↓ $0.49, −51%” followed by “Same dollars. Less command.” This is a rounded purchasing-power conversion based on annual CPI-U values: the 2024 dollar retained about 49% of the purchasing power of a 1995 dollar. The source label reads “BLS CPI-U via FRED.”
Panel 2 is titled “Inflation Is Personal.” It says: “Official CPI is an average. Your household may be living a very different inflation rate.” The three baskets are explicitly labeled “Illustrative household baskets / example pressure mixes.” They are not survey estimates:
- Renter / young family: rent and childcare are marked high; groceries and transport are marked medium.
- Retiree / homeowner: healthcare and insurance are marked high; utilities and property costs are marked medium.
- Commuter / worker: fuel and vehicle costs are marked high; food and rent/insurance are marked medium.
The panel concludes: “Useful average. Imperfect mirror.” Its source label reads “BLS CPI notes.”
Panel 3 is titled “Planning Drift.” A solid blue plan line and a falling dashed reality line are drawn across today, one year, five years, ten years, and thirty years. No numeric forecast is attached to either line. The labels say: “The longer the plan, the more the bent ruler matters,” “The gap widens over time,” and “Small gaps today become large gaps later.” The source label describes the panel as conceptual and based on BLS CPI purchasing-power drift.
The closing line at the bottom of the plate reads: “A bent ruler does not make the builder wrong. It makes the plan unreliable.”
Scope and caveats
The CPI-U is a national average for urban consumers, not a personal cost-of-living index. The $0.49 endpoint uses annual averages and is rounded to the nearest cent. A household’s actual experience depends on what it buys, where it lives, its housing tenure, and how its purchases change. The three household baskets illustrate those differences; they do not quantify them. The planning-drift panel is a conceptual warning, not a thirty-year inflation forecast or investment recommendation.
This figure does not establish why purchasing power changed, which institution or policy caused it, or what asset a reader should hold. Those questions require separate evidence.
Editorial layer
- Sourced: the historical CPI-U series and the purchasing-power calculation shown in Panel 1.
- Inferred: different household spending mixes can produce different experienced inflation, consistent with BLS research on inflation across household groups.
- Argued: a changing unit of account makes long-horizon household planning less reliable when the change is not explicitly included in the plan.
- Illustrative: the pressure dots in Panel 2 and both lines in Panel 3.
Update and correction status
Status: current. The visible historical endpoint, the labels, and the source notes were compared with the cited records on August 27, 2026. The next freshness review is due August 27, 2027. If BLS revises the annual historical series in a way that changes the rounded endpoint, the figure and this transcript must be corrected together.
Evidence receipt
- BLS CPI Inflation Calculator — official calculator for translating purchasing power between periods.
- BLS: Purchasing Power of the U.S. Dollar — explains the reciprocal relationship between prices and purchasing power.
- BLS: Examining U.S. inflation across households grouped by equivalized income — documents why inflation experience can differ across household groups.
- Federal Reserve Bank of St. Louis: CPI for All Urban Consumers — the CPI-U series identified on the plate.
- The Bent Measuring Stick — the related bent.WTF concept page.
- Measurement Failure and Monetary Drift — definitions for the editorial interpretation used here.
Bent Lines BL0001
Ordering Made Easy
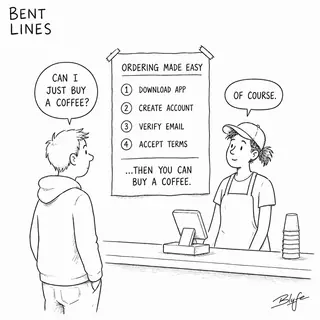
A simple coffee order turns into an app download, an account, an email check, and a set of terms.
Read the visual transcript and evidence receipt
Figure transcript
Main point
The drawing treats digital onboarding as part of the purchase price. The customer wants one coffee; the process assigns four administrative jobs before the transaction can begin.
Reading order
- A customer asks the worker, “Can I just buy a coffee?”
- A large “Ordering Made Easy” sign lists four required setup steps.
- The worker answers, “Of course,” while the sign concludes that coffee comes after the setup.
Material labels and values
The sign reads “Ordering Made Easy” and lists: “1. Download app,” “2. Create account,” “3. Verify email,” and “4. Accept terms,” followed by “…then you can buy a coffee.” The customer asks, “Can I just buy a coffee?” The worker replies, “Of course.”
Scope and caveats
This is an editorial scene, not a measurement of every coffee shop or app-based purchase. It does not estimate how often onboarding is required or how long the four steps take.
Editorial layer
Claim layer: Argued. The argued point is that a low-value transaction can transfer account setup and compliance work to the customer. The joke depends on the gap between the word “easy” and the work shown underneath it.
Update and correction status
Status: current. The website uses the publisher-approved BL0001-Ordering-Made-Easy.png master without changing its pixels, crop, lettering, linework, or Blyfe signature. The imported file was checked on August 28, 2026. Its SHA-256 is e056b494041d934755e599c889e52bff8d646997b31680ee00d904daa22dd91b. Any visual correction requires a new publisher-approved master and a recorded checksum change.
Evidence receipt
- External data: None. This Bent Line is an editorial observation and does not present empirical findings.
- Approved master:
BL0001-Ordering-Made-Easy.png, 1254 × 1254 pixels. - Related bent.WTF records: administrative burden, sludge, access distortion.
Continue through the record
Keep the source record beside the claim.
The Library keeps definitions, exhibits, caveats, and related work close enough to check.
Start with an active file. Open the exhibits when a claim does real work.
Open the Library